Key Takeaways:
- The Subjective Blind Spot: Self-reported scales like the KSS are dangerously unreliable because individuals cannot physically feel or accurately report the onset of microsleeps.
- The Behavioral Bottleneck: While tests like the Psychomotor Vigilance Task (PVT) offer objective data, they require active disruption and cannot continuously monitor an operator during real-world tasks.
- The Neurological Solution: To truly prevent accidents, fatigue must be measured exactly where it starts. The InnoBrain Fatigue Metric uses continuous EEG data to objectively track the brain’s transition through alertness, fatigue, drowsiness, and ultimately, sleep onset.
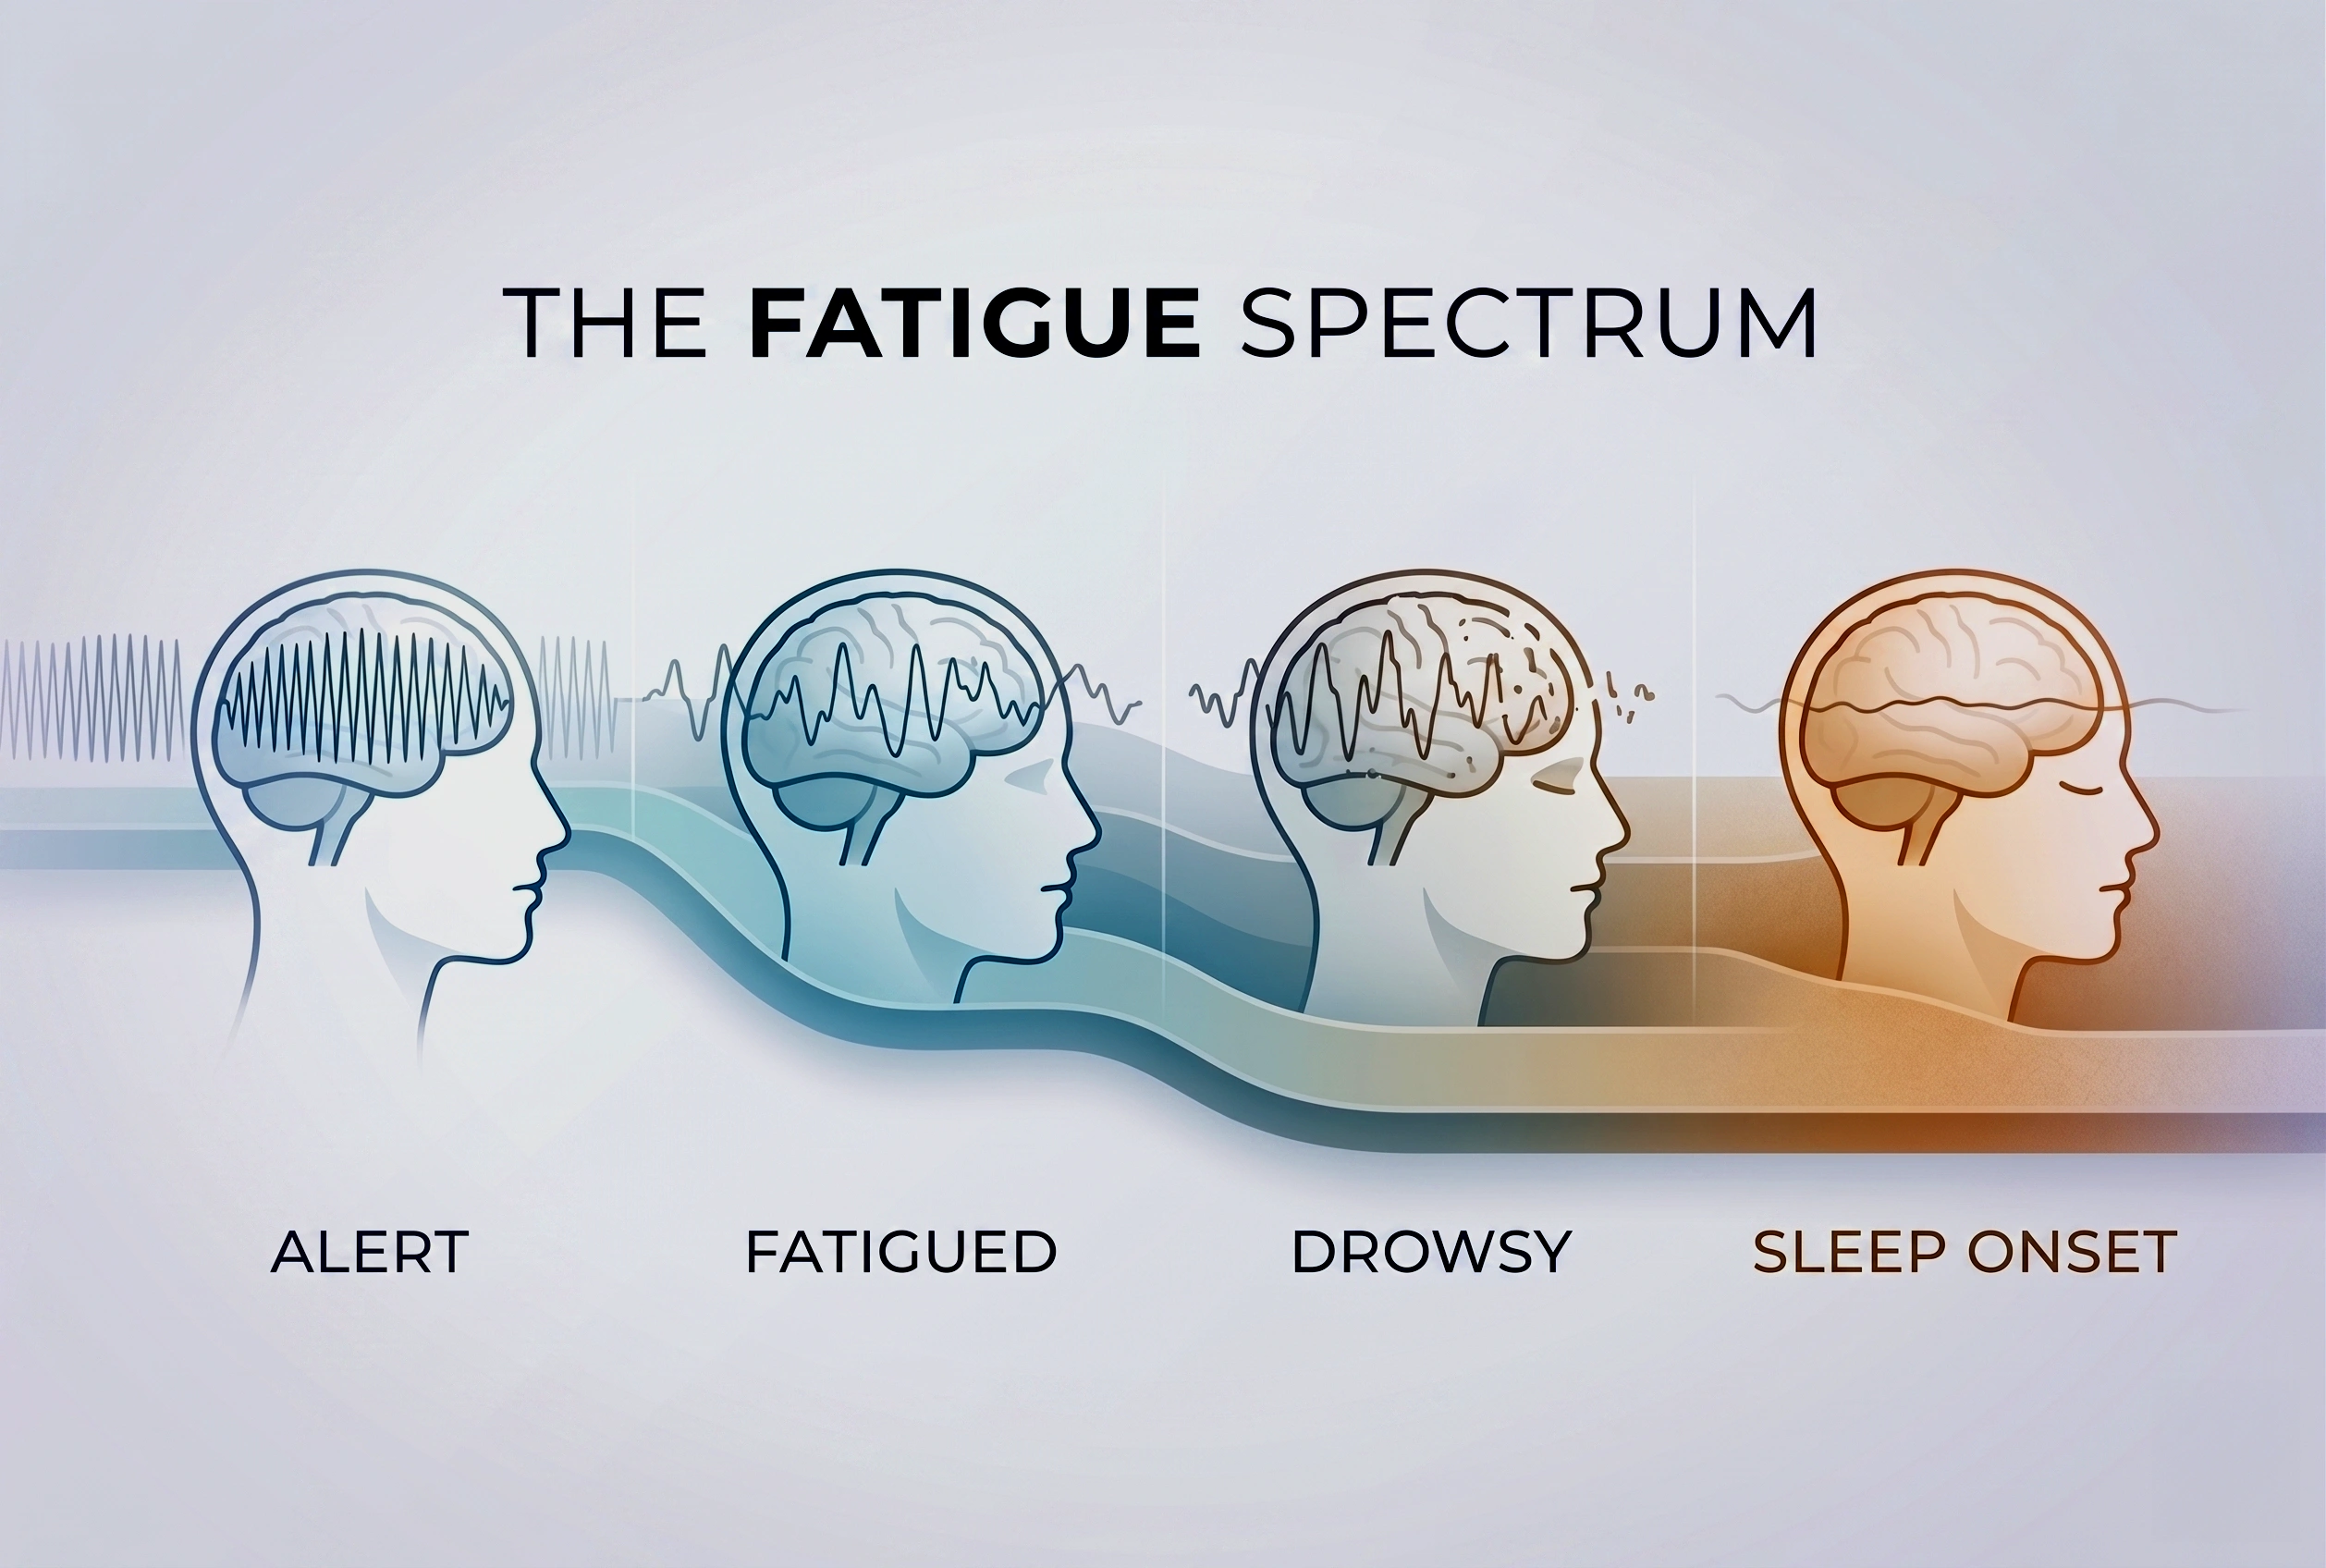
- Introduction of Fatigue Spectrum™: To accurately track the process of brain alertness decline using respective cognitive metrics: Alert, Fatigued, Drowsy, and Sleep Onset.
- The Three Evaluation Models: We introduce InnoBrain DRIFT-B™ (a basic rule-based model), InnoBrain DRIFT-R™ (multi-site feature engineering), and InnoBrain DRIFT-O™ (AI-driven full-scalp analysis) as scalable, objective solutions for catching cognitive decline before a sharp drop in performance.
Drowsiness is a critical safety issue, but how do we accurately measure it? Traditionally, the standard has been the Karolinska Sleepiness Scale (KSS). The KSS is a simple, 9-point questionnaire where individuals rate their own tiredness, ranging from a 1 (“extremely alert”) all the way up to a 9 (“very sleepy, fighting sleep”) (see Table 1) (Akerstedt and Gillberg, 1990).
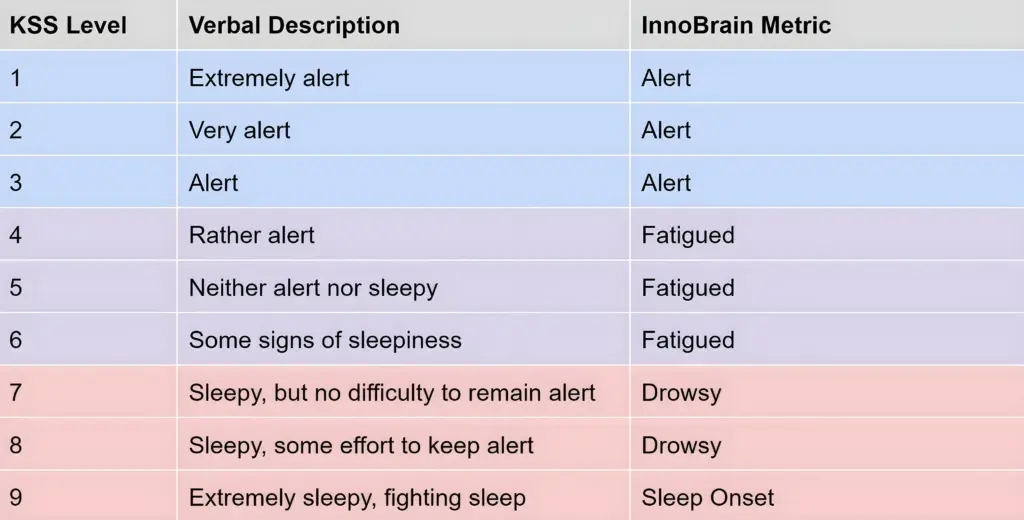 Table 1: The Karolinska Sleepiness Scale levels (Akerstedt and Gillberg, 1990) and the classification of InnoBrain Fatigue metrics.
While it sounds straightforward, relying on the KSS comes with a dangerous drawback: it is entirely subjective. When someone first starts their shift, they might feel completely fine and confidently report that they are highly alert. But as the work drags on, their brain secretly begins to slip into dangerous “microsleeps”, even if they still believe they are awake. A driver might rate themselves a “3” or “4” because they just drank a coffee, completely unaware that these lapses are already happening.
Microsleep is a fleeting, uncontrollable episode of sleep that can last anywhere from a fraction of a second to up to 30 seconds. The terrifying part is that eyes might still be wide open, and one usually has absolutely no idea it just happened. To the person experiencing it, it might just feel like a momentary lapse in focus or a long blink, but in reality, the brain has temporarily gone offline (Poudel et al., 2014).
Because people cannot feel these microsleeps happening, they consistently overestimate their alert state and heavily underestimate their actual fatigue. Relying on them to self-report is a massive blind spot.
To solve this, we propose a radically different approach: a real-time, objective metric extracted directly from the brain. In this blog post, we will introduce three models for measuring fatigue (InnoBrain DRIFT-B™, InnoBrain DRIFT-R™, and InnoBrain DRIFT-O™), breaking down their key differences, how they work, and exploring their accuracy in detail.
The Fatigue Spectrum™
In everyday conversation, people often use the words “fatigue” and “drowsiness” interchangeably. However, they represent a single, continuous spectrum of declining brain alertness. To accurately track this decline with InnoBrain’s respective metrics, we break the spectrum down into four distinct stages:
- Alert: Fully awake, with no signs of fatigue.
- Fatigued: Moderate fatigue, accompanied by a slight loss of focus.
- Drowsy: Severe fatigue, requiring conscious effort to stay alert. This stage carries a high risk of microsleeps.
- Sleep Onset: Extreme difficulty or a complete inability to stay awake.
The Behavioral Benchmark: The PVT Task
To objectively evaluate our models, we use the Psychomotor Vigilance Task (PVT). In simple terms, the PVT is a highly repetitive reaction-time test in which the participant stares at a screen and waits for a visual stimulus (such as a red dot) to appear at random intervals between 2 and 10 seconds. The moment it does, the person must press a button as fast as possible. It does not measure intelligence or skill; it strictly measures continuous focus and how well one can stay alert over a period of time.
Our testing protocol consists of three consecutive PVT sessions, each lasting 10 minutes, with self-paced breaks between sessions. Participants complete the KSS after each session. In total, we have 23 participants.
In fact, because the task is so highly repetitive and monotonous (frankly, it is quite boring), it is notorious for actually inducing drowsiness in people (Basner and Dinges, 2011). This lack of stimulation makes it the perfect tool for evaluating fatigue. Researchers rely on behavioral metrics like the PVT to assess fatigue because, unlike the KSS, it is an objective, real-time measurement. You can’t fake a fast reaction time if your brain is falling asleep. In this task, researchers don’t just look at average reaction times; they look for lapses. A lapse is formally defined as any reaction taking longer than 500 milliseconds (Lee et al., 2010).
The Drawbacks of Behavioral (PVT) Testing
While the PVT is incredibly useful in a lab, it is fundamentally flawed when applied to the real world, including:
- The “Distraction” Flaw: We can’t always definitively understand the source of a high reaction time. If someone takes 600ms to react, is it because they are fatigued, or simply because they got distracted for a split second (Anderson et al., 2010)?
- Impractical for Real Life: We cannot realistically ask a truck driver or a machine operator to play a reaction-time game on a screen while they are actively driving or working! It only works in controlled, uninterrupted lab settings.
- Massive Subject Differences: There are huge natural variances in individual reaction times. Some people naturally have lightning-fast reflexes; they might be severely fatigued but still manage to hit the button in under 500ms, meaning we detect their fatigue far too late. Conversely, some people are naturally slower in general. If their baseline reaction time is 450 ms, even a small increase in reaction time can be wrongly labeled as fatigue, even when they are fully alert (Dongen et al., 2004).
PVT and KSS performance
To understand why KSS and PVT are not enough, look at the case of a particular subject from our lab data.
During their session, the expert observing the subject saw obvious physical signs of fatigue, including prolonged blinking and brief times of total eye closure, and clear signs of fatigue in the EEG. However, this subject reported their fatigue state as only a 5 on the KSS. Furthermore, despite the obvious physical signs of fatigue, they managed to keep their PVT reaction time strictly under the 500ms threshold for most of the time (only 9 lapses in 30 min). This perfectly shows why both the subjective (KSS) and behavioral (PVT) metrics failed to catch the danger, and why we need our brain-based metric to catch the truth (see Figure 1).
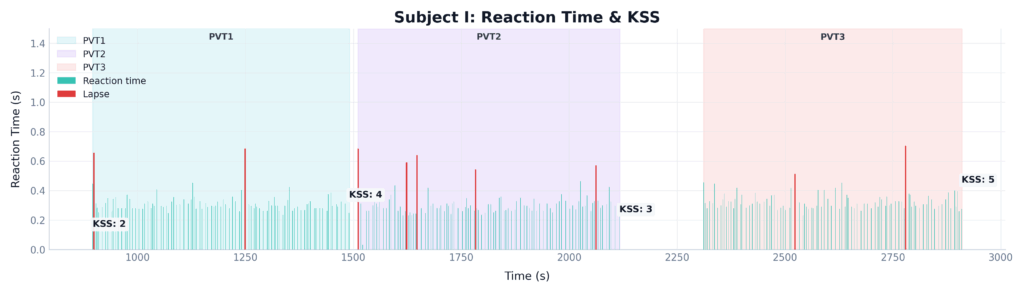 Figure 1: Time-series comparison of subjective (KSS) and behavioral (PVT Lapses) for a single subject across three 10-minute PVT sessions.
Brain-based fatigue detection: InnoBrain Models
Since current methods like KSS and PVT have the limitations we’ve discussed, we are looking directly at the source. We developed three distinct models to calculate fatigue directly from EEG data. Before breaking down the architecture of these three models, it helps to understand the terminology. We use the term “DRIFT™” because it perfectly describes the gradual, often imperceptible neurological shift that occurs as a person loses focus. The brain does not simply switch from awake to asleep; rather, its dominant frequencies slowly drift from the rapid, engaged rhythms of active alertness down into the slower patterns associated with fatigue and drowsiness.
Here is how the three variations of the InnoBrain metric capture that process:
- InnoBrain DRIFT-B™ (The Basic Model): A rule-based mathematical model that estimates fatigue based on features derived from theta and alpha EEG activity recorded over posterior scalp regions (Kaida et al., 2006).
- InnoBrain DRIFT-R™ (The Hand-Engineered Expert Model): A more comprehensive multi-region rule-based EEG model that estimates fatigue using activity from parietal, occipital, central, and frontal scalp regions, enabling a more accurate fatigue estimate.
- InnoBrain DRIFT-O™ (The AI Model): Our most advanced fatigue estimation model is designed to leverage the full available EEG montage while remaining flexible across different hardware configurations. Its AI-based architecture adapts to varying electrode setups, enabling robust fatigue estimation with minimal loss in accuracy.
Let’s return to the subject we examined earlier. Figure 2 adds our objective EEG-based metrics to the exact same time series. It perfectly shows how the InnoBrain models bypass the limitations of subjective and behavioral testing. Despite the participant experiencing a severe level of fatigue that went entirely undetected by both the KSS and PVT, InnoBrain DRIFT-B™, InnoBrain DRIFT-R™, and InnoBrain DRIFT-O™ accurately captured the steady cognitive decline.
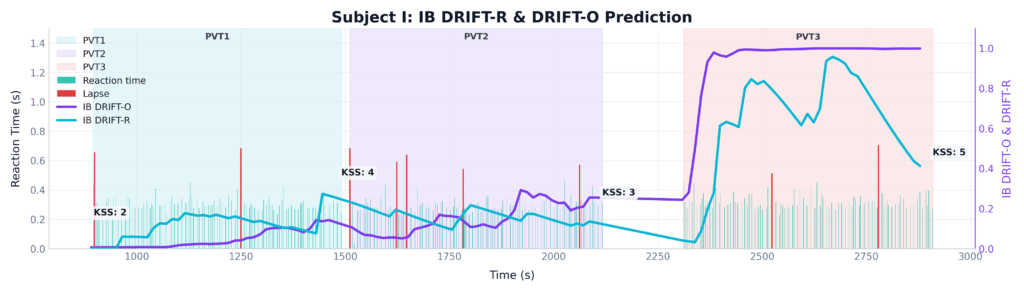 Figure 2: Time-series comparison of subjective (KSS), behavioral (PVT Lapses), and objective neurological (DRIFT-O™ and DRIFT-B™) InnoBrain fatigue metrics for a single subject across three 10-minute PVT sessions.
Validation of the Models
Evaluating true accuracy is a challenge. Because we know behavioral metrics have flaws (distraction vs. fatigue) and KSS is biased, what is our “ground truth”? We anchor our evaluation on one proven, undeniable fact: People are objectively more fatigued in their 3rd PVT session than in their 1st. We know that some people may begin the task fatigued, while others may not experience significant fatigue at all. However, it is the best practical standard available to us, as we know that an individual’s overall cognitive depletion reliably increases from the beginning of a task to the end (Cellini et al., 2023) (Both the behavioral data and KSS trends support this, see Figure 3).
The Statistical Proof: A repeated-measures ANOVA revealed a highly significant difference across the different stages of the experiment for both KSS scores (F(2, 22) = 25.80, p < 0.001) and the number of lapses (F(2, 22) = 3.68, p = 0.033). Post-hoc pairwise t-tests with Bonferroni correction showed significant differences between PVT 1 and PVT 2, as well as between PVT 1 and PVT 3, for both metrics.
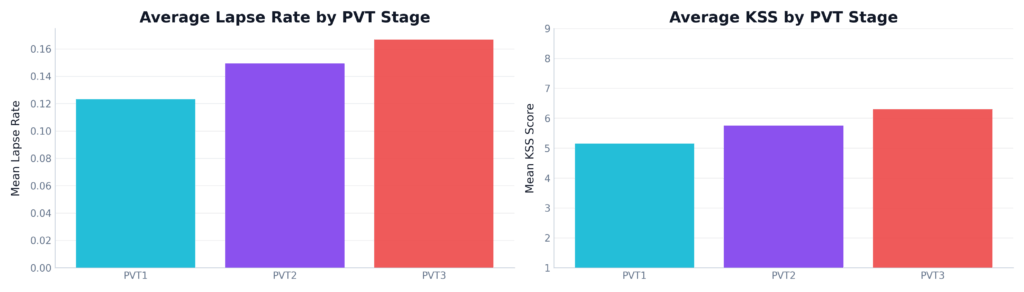 Figure 3: Average KSS scores and PVT lapse rates across three testing sessions. Both the self-reported sleepiness and the physical behavioral lapses show a clear, statistically significant increase from PVT 1 to PVT 3.
When we evaluated our models against this ground truth, the results were clear. While InnoBrain DRIFT-B™ provided a baseline, both InnoBrain DRIFT-R™ and our InnoBrain DRIFT-O™ consistently and correctly tracked the increase of fatigue over time.
To truly understand how much better InnoBrain’s Foundation AI model performs, we evaluated all three models across three strict evaluation metrics. To ensure these results hold true in the real world, we employed a Leave-One-Subject-Out Cross-Validation (LOSOCV) method. By training the model on the entire group while withholding a single participant for testing, we can confirm the system’s ability to generalize across new individuals. This iterative validation proves that the metric is not just memorizing specific patterns but is truly subject-independent and robust enough for unseen users (see Figure 4):
- ROC AUC: This metric measures how well the model can tell the difference between an ‘Alert’ state and a ‘Fatigued’ state. It shows separability and measures how well the model separates the two classes, independent of a fixed threshold. InnoBrain DRIFT-B™ struggled here (0.56, barely better than a coin flip), and the expert InnoBrain DRIFT-R™ showed moderate success (0.70). However, our AI-driven model, InnoBrain DRIFT-O™, achieved a massive 0.90, showing exceptional discriminative power.
- F1 Score: This metric shows detection reliability and the balance between precision and recall. It is useful when false positives and false negatives both matter. InnoBrain DRIFT-O™ scored a 0.87, making it highly dependable for real-world applications.
- Balanced Accuracy: This metric shows fair performance across different classes in case there is class imbalance, when one class has more samples than the other. InnoBrain DRIFT-O™ dominated with 0.88, proving it doesn’t just guess ‘alert’ to artificially inflate its score.
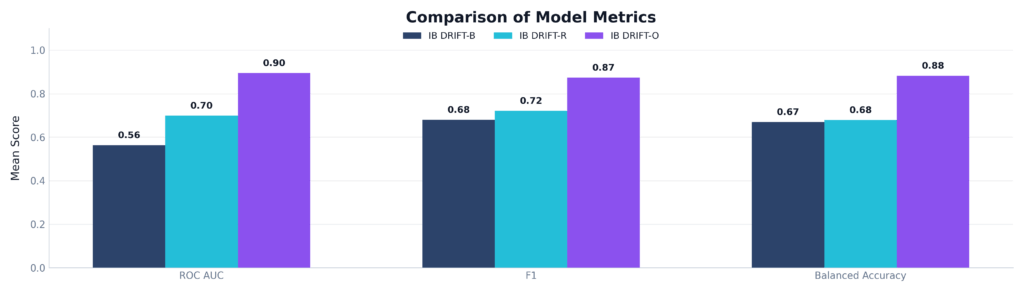 Figure 4: Comparison of ROC AUC, F1 Score, and Balanced Accuracy across the three proposed models. InnoBrain DRIFT-O™ significantly outperforms both InnoBrain DRIFT-B™ and InnoBrain DRIFT-R™, achieving scores of >0.85 in all categories.
The Models in Action
To see the difference, we plotted the average predicted fatigue of both models (InnoBrain DRIFT-R™ and InnoBrain DRIFT-O™) continuously over a 30-minute period (three back-to-back 10-minute PVT sessions). We also overlaid the subjective KSS scores for reference (see Figure 5).
The KSS scores (dark triangles) show a clear, steady accumulation of fatigue, rising from a baseline of 3.45 up to 6.30 by the end of the experiment.
Look at the blue line representing the hand-engineered expert model (InnoBrain DRIFT-R™). While it correctly identifies an overall upward trend, it is highly volatile. Notice the sharp, sudden drops exactly at the 10-minute and 20-minute marks. InnoBrain DRIFT-R™ gets ‘tricked’ by the subtle shift in arousal when a new task session begins, falsely dropping the fatigue score before climbing back up.
Now, look at the purple line representing InnoBrain DRIFT-O™. It is incredibly smooth and stable. The model is smart enough to ignore the superficial novelty of a new session starting. Instead, it accurately tracks the underlying, cumulative neurophysiological fatigue, perfectly mirroring the steady, relentless climb of the subject’s true tiredness.
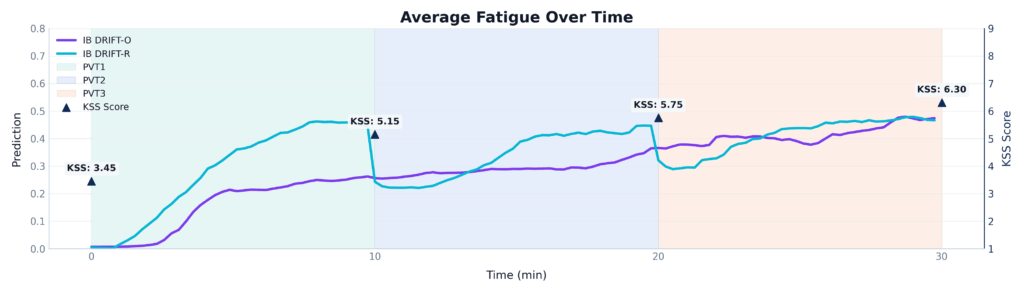 Figure 5: A time-series comparison of InnoBrain DRIFT-R™ and InnoBrain DRIFT-O™ averaged across three 10-minute PVT sessions.
When we look at specific case studies, the power of the InnoBrain DRIFT-O™ model becomes even more apparent:
- Example A: When Both Models Agree:
In many standard cases, both InnoBrain DRIFT-R™(the hand-engineered model) and InnoBrain DRIFT-O™(the Foundation AI model) work correctly, accurately matching the subject’s increased level of fatigue. Looking at Figure 6, one can see that during the first 10 minutes (PVT 1), both models agree that the subject is alert. As the subject pushes into PVT 2 and PVT 3, both the blue line (InnoBrain DRIFT-R™) and the purple line (InnoBrain DRIFT-O™) detect the onset of fatigue and begin to rise. While the DRIFT-O™ model (orange) is more sensitive to the severe fatigue at the very end of the session, the expert model successfully caught the overall trend.
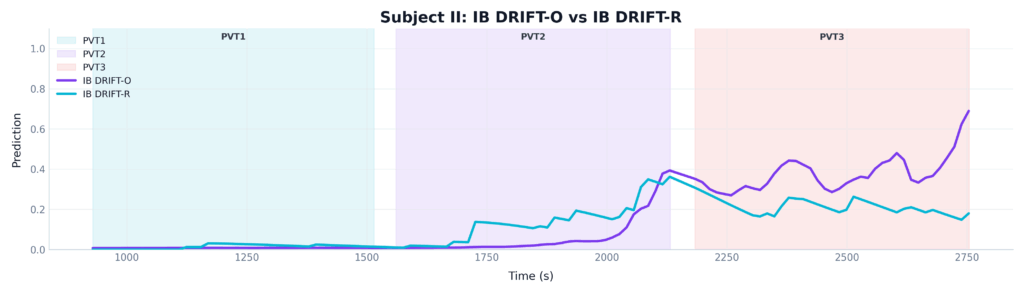 Figure 6: A comparison of InnoBrain DRIFT-R™(green) and InnoBrain DRIFT-O™ (orange) in one subject
- Example B: The Advantage of Foundation AI Model in Complex Cases: However, human brains are highly variable. In highly complex cases, where a subject’s natural baseline or unique brain-wave patterns trick the standard algorithms, only InnoBrain DRIFT-O™ is able to cut through the noise and correctly identify the true level of fatigue, see Figure 7. The DRIFT-R™ model (blue line) completely fails. It flatlines at zero, falsely reporting that the subject is perfectly alert for the entire 30 minutes. The DRIFT-O™ model (orange line), however, adapts to the subject’s unique baseline and correctly detects the massive spike in fatigue during the final session.
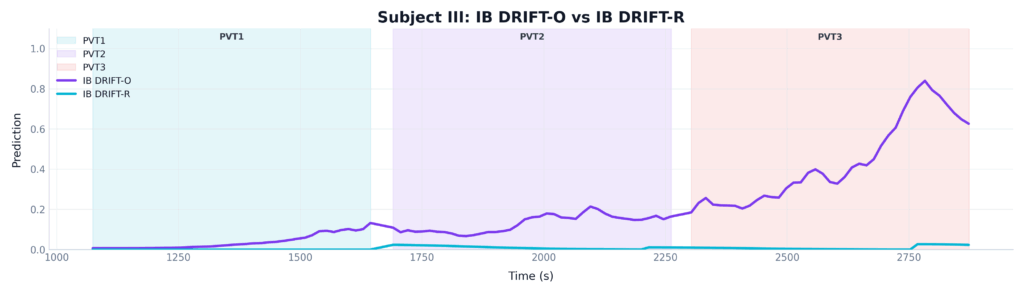 Figure 7: A comparison of InnoBrain DRIFT-R™ (green) and InnoBrain DRIFT-O™ (orange) in one subject
Moving Beyond Guesswork
When it comes to safety in high-stakes environments, whether it’s production line, long-haul trucking, heavy machinery operation, or aviation, guessing isn’t good enough. As our research shows, relying on operators to self-report their tiredness is a dangerous gamble, and reaction-time games are fundamentally impractical for the real world. By tapping directly into the brain, we bypass human error entirely. Our AI-driven metric, InnoBrain DRIFT-O™, proves that we can now monitor cognitive fatigue objectively, continuously, and with over 90% accuracy. It’s time to stop waiting for physical mistakes to happen and start catching fatigue exactly where it begins: in the brain. By making the invisible visible, we can finally stop a microsleep before it turns into a macro-disaster.
References
- Akerstedt T, Gillberg M. (1990). Subjective and objective sleepiness in the active individual. International Journal of Neuroscience, 52, 29–37.
- Anderson, C., Wales, A. W., & Home, J. A. (2010). PVT lapses differ according to eyes open, closed, or looking away. Sleep, 33(2), 197-204.
- Basner M; Dinges DF. Maximizing sensitivity of the psychomotor vigilance test (PVT) to sleep loss. SLEEP 2011;34(5):581-591.
- Cellini, N., Bruno, G., Orsini, F., Vidotto, G., Gastaldi, M., Rossi, R., & Tagliabue, M. (2023). The effect of partial sleep deprivation and time-on-task on young drivers’ subjective and objective sleepiness. International journal of environmental research and public health, 20(5), 4003.
- Lee, I. S., Bardwell, W. A., Ancoli-Israel, S., & Dimsdale, J. E. (2010). Number of lapses during the psychomotor vigilance task as an objective measure of fatigue. Journal of clinical sleep medicine, 6(2), 163-168.
- Poudel, G. R., Innes, C. R., Bones, P. J., Watts, R., & Jones, R. D. (2014). Losing the struggle to stay awake: divergent thalamic and cortical activity during microsleeps. Human brain mapping, 35(1), 257-269.
- Van Dongen, P. A., Baynard, M. D., Maislin, G., & Dinges, D. F. (2004). Systematic interindividual differences in neurobehavioral impairment from sleep loss: evidence of trait-like differential vulnerability. Sleep, 27(3), 423-433.
- Kaida, K., Takahashi, M., Åkerstedt, T., Nakata, A., Otsuka, Y., Haratani, T., & Fukasawa, K. (2006). Validation of the Karolinska sleepiness scale against performance and EEG variables. Clinical neurophysiology, 117(7), 1574-1581.