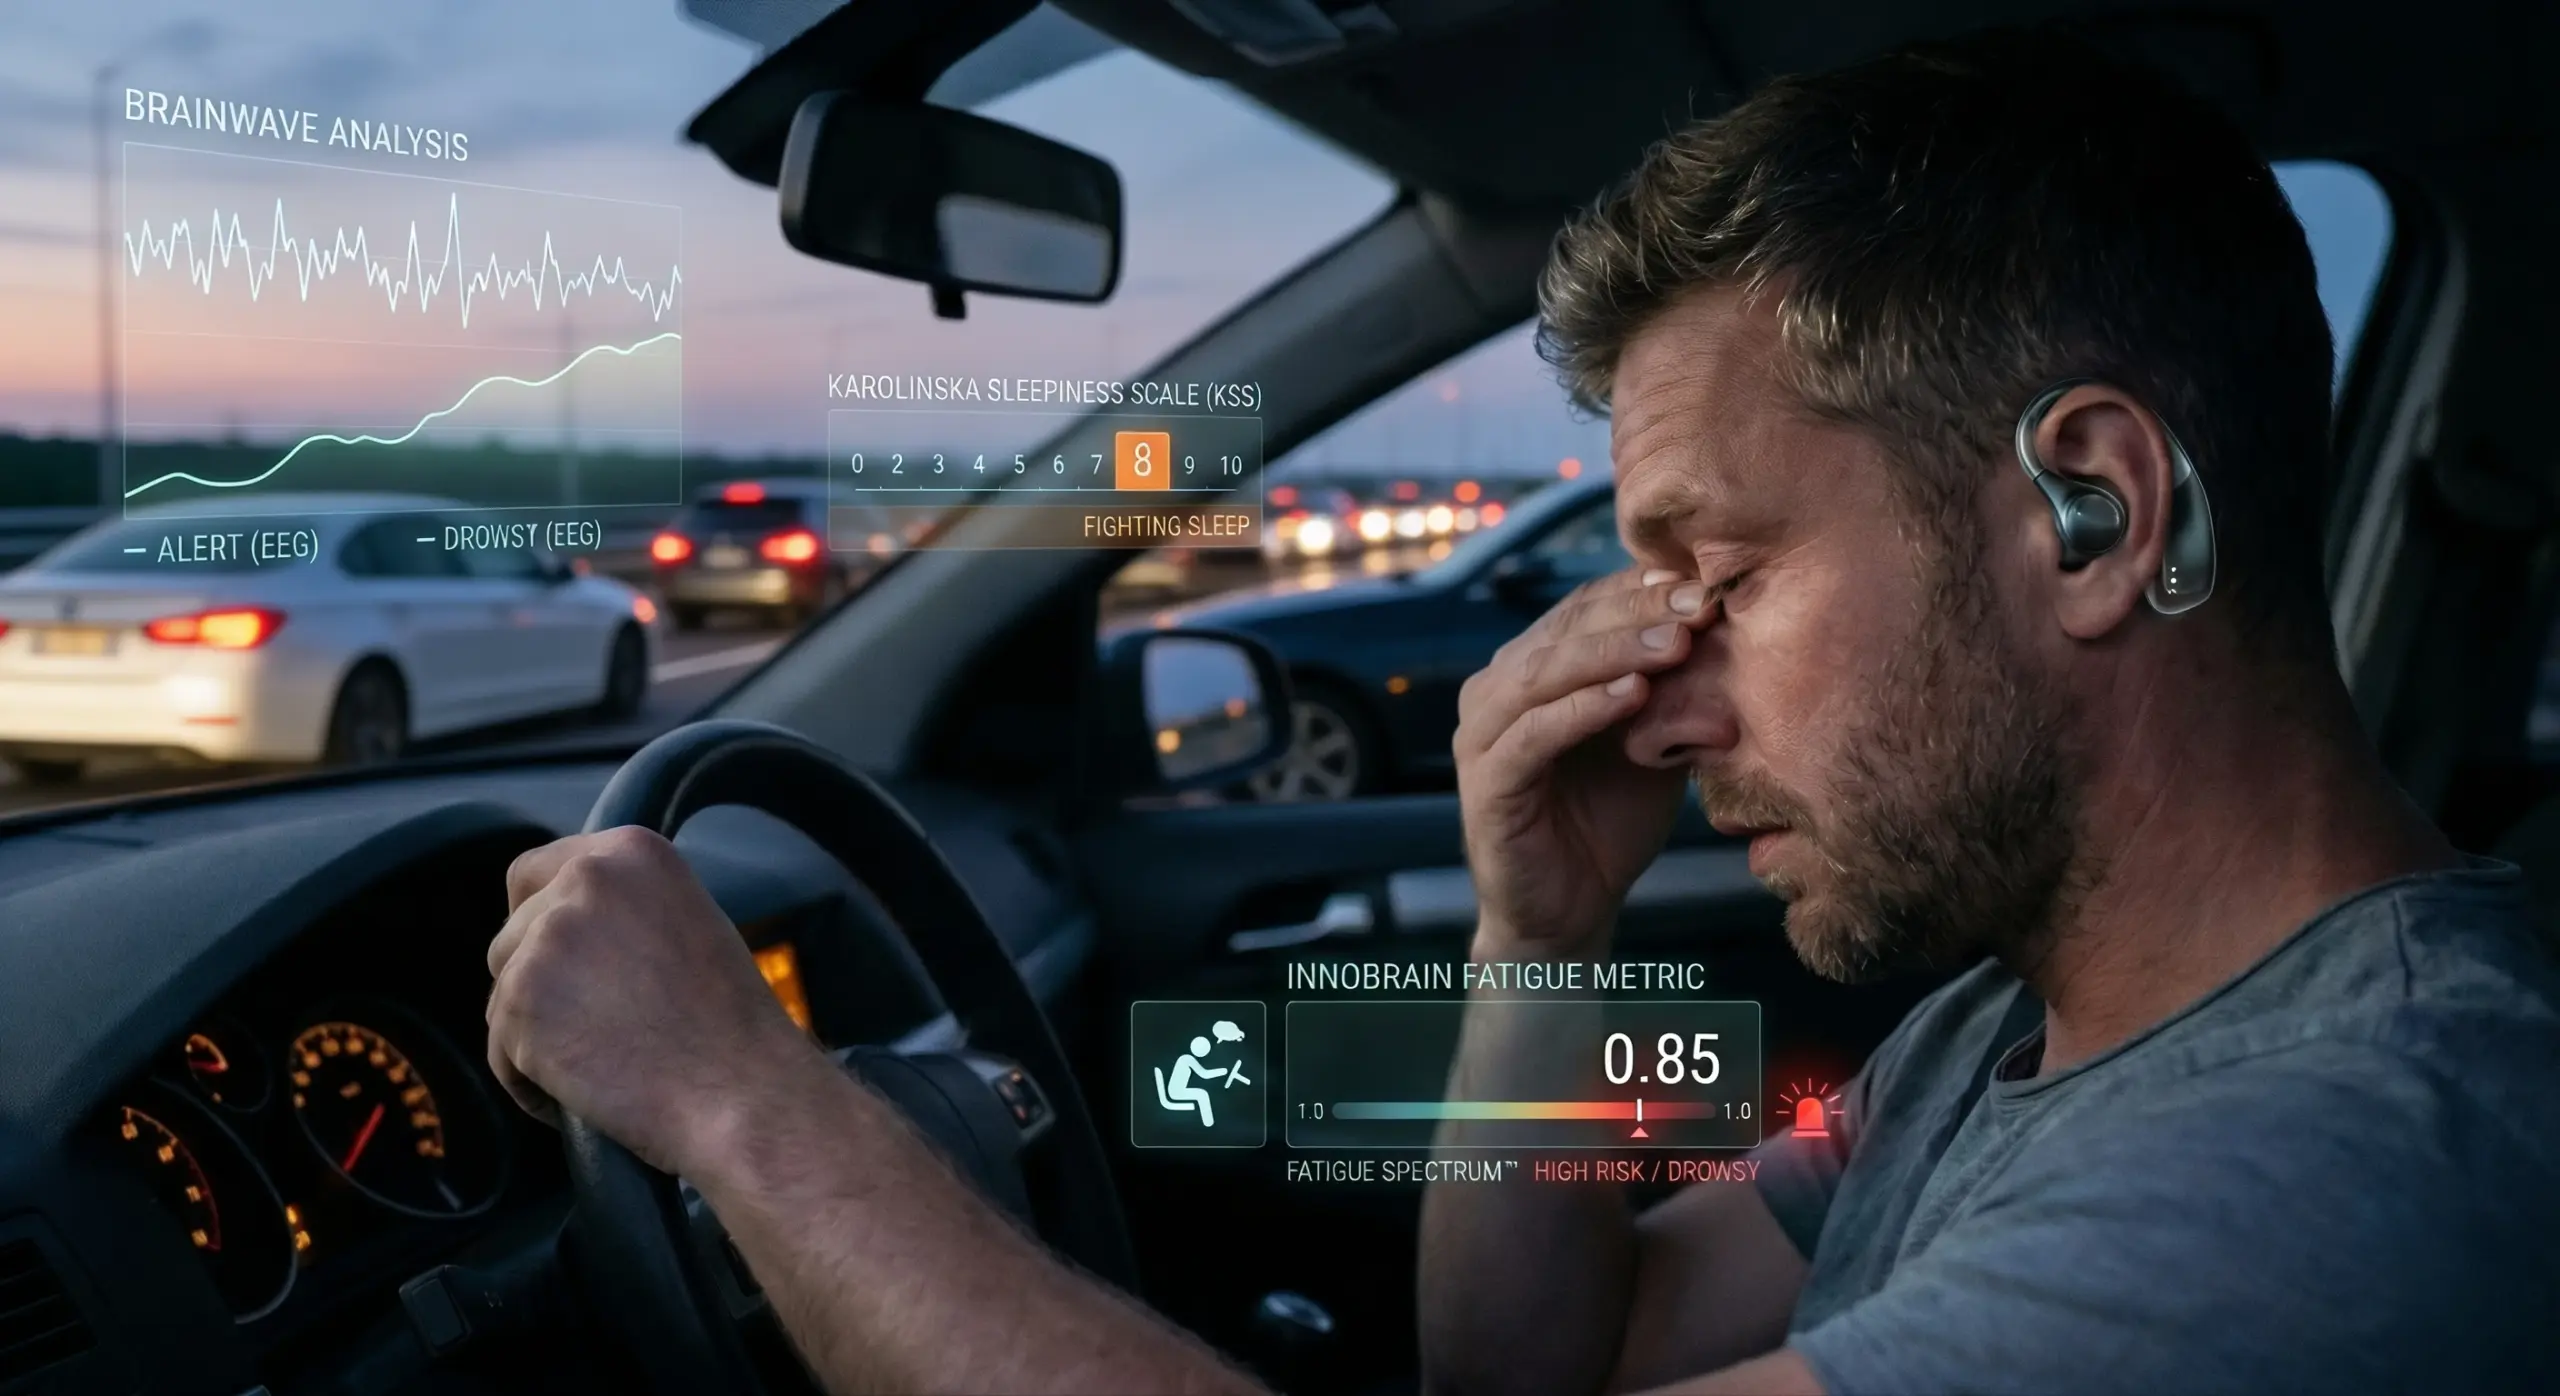
Driver fatigue isn’t just a feeling; it’s a measurable cognitive state with life-altering consequences. In common language and literature, the terms fatigue, drowsiness, and sleepiness are often used to describe different stages of this condition. Fatigue generally refers to the initial onset, while drowsiness and sleepiness indicate an increased tendency to fall asleep or difficulty staying awake. We therefore introduced the term Fatigue Spectrum™ to lift a long-standing confusion within the field, for a better understanding of the process. In this context, respective cognitive metrics capture the entire spectrum, ranging from 0 (completely alert with no signs of tiredness) to 1 (highly drowsy and fighting the urge to sleep).
One of the common ways to measure fatigue is by using the Karolinska Sleepiness Scale (KSS) (Akerstedt & Gillberg, 1990). The KSS is a 9-point self-report questionnaire where drivers rate their current state. The scale ranges from 1 (‘extremely alert’) through 5 (‘neither alert nor sleepy’) down to 9 (‘very sleepy, great effort to keep awake, fighting sleep’). While the KSS has long been the research “gold standard” for subjective sleepiness, the industry is shifting toward objective, real-time monitoring to overcome human bias and data gaps.
In this post, we report in detail our method for validating InnoBrain’s fatigue metric. Using a driving simulator, we aimed to determine how accurately continuous neural data recorded from in-ear EEG can track the progression of fatigue in real-time when compared to traditional assessment methods.
Beyond Subjective Limitations: Why KSS Isn’t Enough
While the KSS remains a research staple, it is insufficient on its own for real-time safety monitoring, where continuous, high-resolution insights are essential for assessing levels of fatigue that affect safety. Beyond the fact that it is not a continuous measurement and creates a cognitive distraction for the driver (Sahayadhas et al., 2012), it suffers from a critical psychological flaw: the human bias of misperception. Drivers often overestimate their طperformance capacity and underestimate their true stage within the Fatigue Spectrum™ when drowsy. (Van Dongen et al., 2003; Reyner and Horne, 1998; Watling et al., 2015). This means that by the time a participant acknowledges and reports a high fatigue score, their cognitive functions and reaction times have already significantly deteriorated. This delayed awareness creates a dangerous window of risk. In contrast, the InnoBrain Fatigue Model detects subtle neural shifts toward drowsiness long before the driver consciously realizes they are impaired, closing the “awareness gap” between feeling tired and being unsafe.
Cognitive Metrics of the Fatigue Spectrum™
This metric continuously assesses the level of human cognitive state over time, categorizing it into four distinct levels to indicate which best reflects the current condition:
- Alert: Fully awake, with no signs of fatigue.
- Fatigued: Moderate fatigue, accompanied by a slight loss of focus.
- Drowsy: Severe fatigue, requiring conscious effort to stay alert. This stage carries a high risk of microsleeps.
- Sleep Onset: Extreme difficulty or a complete inability to stay awake.
During the “Drowsy” stage, individuals become highly susceptible to microsleeps. These are brief, involuntary episodes of sleep that typically last anywhere from a fraction of a second up to 30 seconds (Golz et al., 2011). Because the onset is so rapid, people frequently slip into these momentary bouts of sleep completely unintentionally and often wake up without realizing they had lost consciousness (Poudel et al., 2014). This lack of awareness makes the drowsy stage exceptionally dangerous for tasks requiring continuous engagement, such as driving or operating machinery.
The Experimental Setup
To capture the transition from alertness to drowsiness, we designed a protocol involving two 30-minute driving sessions in a simulated environment. Our goal was to compare traditional subjective reporting with modern physiological data. We collected data from 18 subjects, resulting in 36 unique datasets. To evaluate the drivers’ levels of fatigue, we utilized an in-ear EEG alongside traditional reporting:
- Subjective Measure: KSS scores were collected at the start, middle, and end of the experiment.
- Objective Measure: The InnoBrain fatigue metric was calculated in 5-minute intervals using in-ear EEG sensors.
Data Integrity: Our Custom Cleaning Pipeline
EEG signals can be susceptible to various artifacts, from subtle head movements to electromagnetic interference. To ensure the highest signal-to-noise ratio, we implemented our proprietary data cleaning and preprocessing pipeline. By utilizing this specialized pipeline and its cleaning algorithms, our system identifies and removes any data contaminated by artifacts. By excluding these compromised segments, we ensured that our fatigue analysis was conducted only on high-quality, “clean” neural data.
The Results: Do the Brain Waves Match the Feeling?
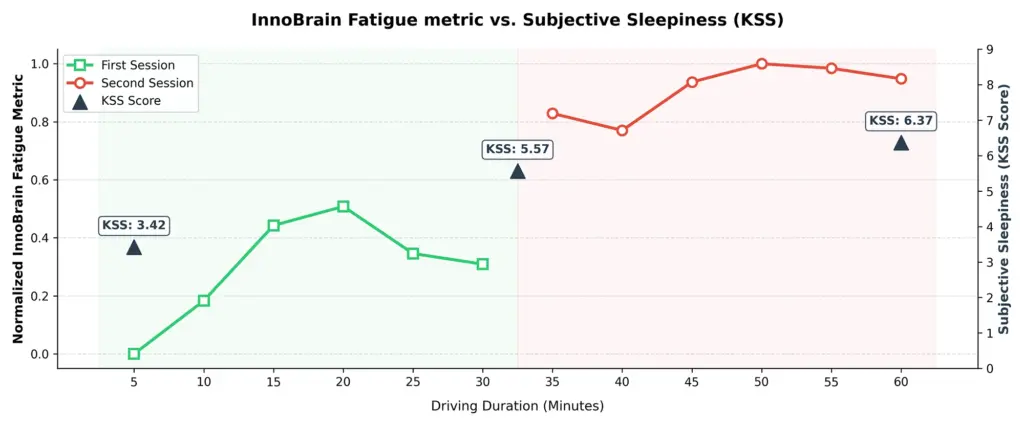
Figure 1: Correlation between the real-time InnoBrain Fatigue Metric and KSS across sessions.
The data revealed a clear, upward trajectory of fatigue, but the most compelling finding was the correlation between the real-time InnoBrain fatigue metric and subjective sleepiness (KSS) across sessions.
1. A Significant Rise in Fatigue
When comparing the first 5 minutes of the drive to the final 5 minutes, the InnoBrain fatigue metric showed a statistically significant increase (t(17) = 3.7, p = 0.001, Cohen’s d = 0.86). This confirms that as the drive progressed, the physiological markers of fatigue became undeniably more pronounced.
2. The Subjective-Objective Mirror
As seen in the data plot, the KSS scores (black triangles) and the InnoBrain Fatigue metric (green and red lines) follow a nearly identical trend. The “sharp” increase in KSS was met with an equally sharp increase in the in-ear EEG fatigue metric.
3. Potential Compensatory Effort and Visualizing the “Awareness Gap
Looking at the first 30-minute session (the green line in Figure 1), fatigue rises steadily but appears to dip slightly just before the session ends. In cognitive psychology, this is sometimes referred to as compensatory effort or the “end-spurt” effect. As drivers subconsciously realize a break is approaching, they may be able to temporarily marshal their remaining cognitive resources to help maintain focus.
At the 60-minute mark, drivers reported an average KSS score of 6.37. On the 9-point scale, this translates to feeling “some signs of sleepiness”, meaning the drivers felt moderately tired but likely believed they were still capable of operating the vehicle safely. However, at that same moment, the InnoBrain metric approached 1.0, which indicates a state closer to severe drowsiness. This observation suggests that continuous EEG can help detect levels of impairment that a driver might not fully recognize, illustrating a potential “awareness gap” between subjective feeling and objective cognitive state.
Why This Matters
The high correlation between these metrics suggests that the InnoBrain fatigue metric for in-ear EEG is a highly reliable tool for detecting fatigue in real-time. Unlike traditional EEG caps, in-ear sensors are practical for real-world driving environments.
Knowing that we can objectively measure the “invisible wall” of fatigue brings us one step closer to smarter, safer vehicle systems that know when a driver needs a break, even before the driver does. This opens the doors to fatigue-aware human assistance systems, adaptive training protocols, and early-warning safety interventions in fields beyond mobility, such as production and operator monitoring.
Reference
- Akerstedt T, Gillberg M. (1990). Subjective and objective sleepiness in the active individual. International Journal of Neuroscience, 52, 29–37
- Van Dongen, H. P., Maislin, G., Mullington, J. M., & Dinges, D. F. (2003). The cumulative cost of additional wakefulness: dose-response effects on neurobehavioral functions and sleep physiology from chronic sleep restriction and total sleep deprivation. Sleep, 26(2), 117-126.
- Reyner, L. A., & Horne, J. A. (1998). Falling asleep whilst driving: Are drivers aware of prior sleepiness? International Journal of Legal Medicine, 111(3), 120–125.
- Watling, C. N., Armstrong, K. A., & Radun, I. (2015). Examining signs of driver sleepiness, usage of sleepiness countermeasures, and the associations with sleepy driving behaviours. Accident Analysis & Prevention, 85, 22–29.
- Sahayadhas, A., Sundaraj, K., & Murugappan, M. (2012). Detecting driver drowsiness based on sensors: a review. Sensors, 12(12), 16937-16953.
- Golz, M., Sommer, D., Krajewski, J., Trutschel, U., & Edwards, D. (2011, June). Microsleep episodes and related crashes during overnight driving simulations. In Driving Assessment Conference (Vol. 6, No. 2011). University of Iowa.
- Poudel, G. R., Innes, C. R., Bones, P. J., Watts, R., & Jones, R. D. (2014). Losing the struggle to stay awake: divergent thalamic and cortical activity during microsleeps. Human brain mapping, 35(1), 257-269.