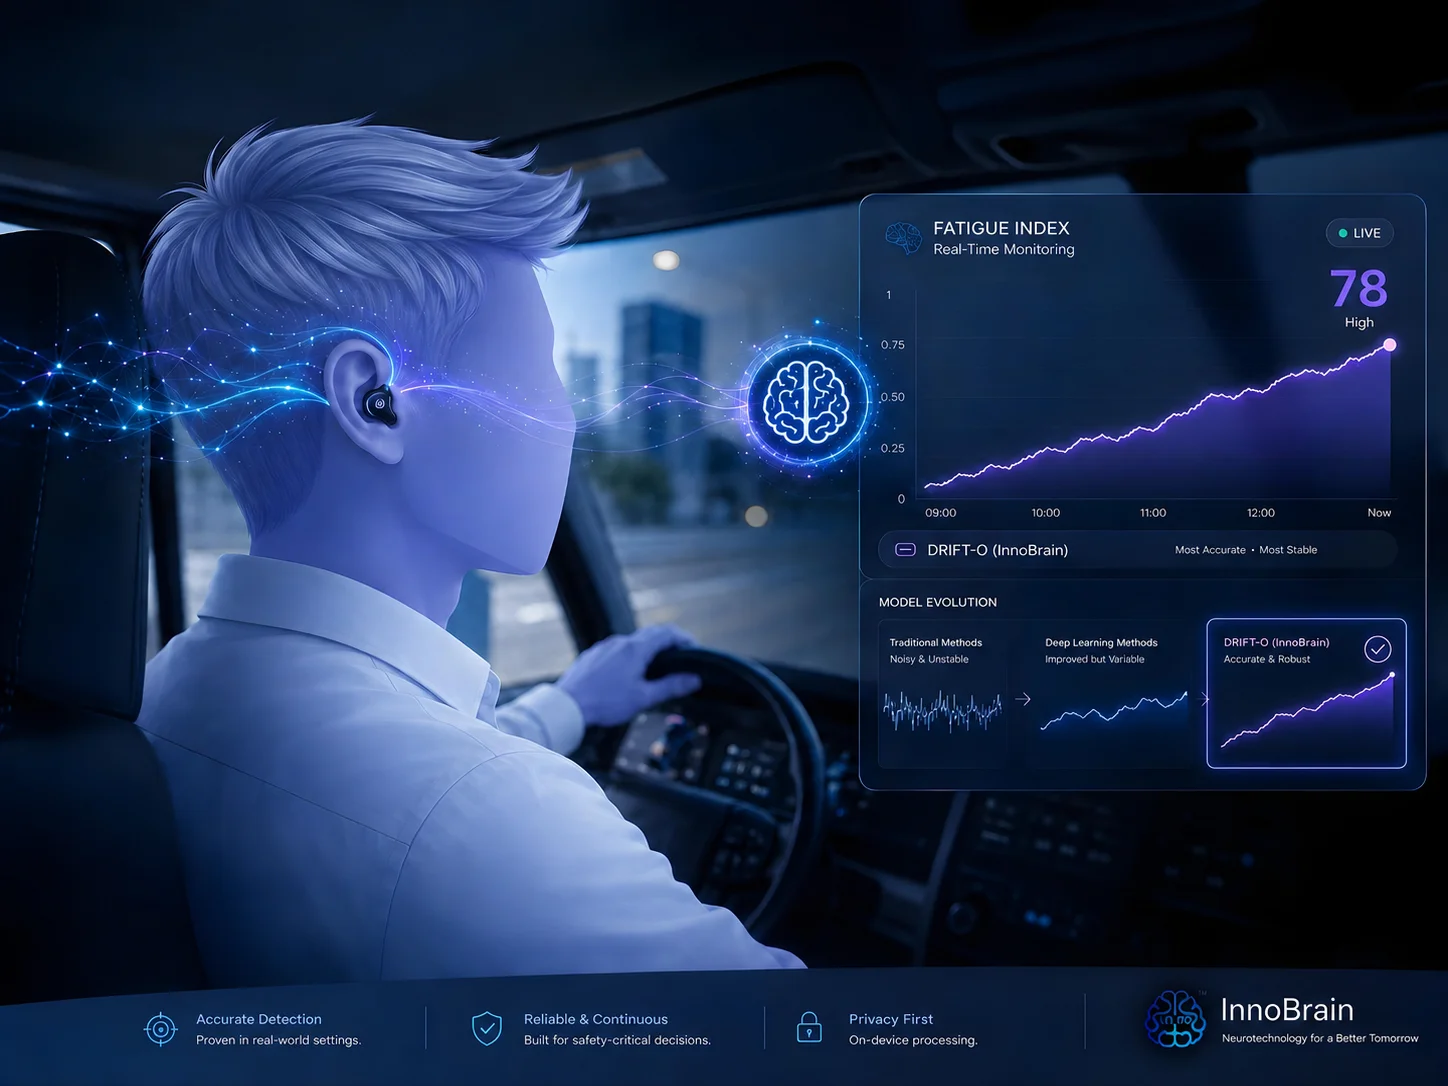
While traditional scalp EEG provides the most comprehensive data, it isn’t always practical for everyday use. In real-world operational environments, human comfort and mobility often outweigh the need for a full-scalp array. For these use cases, in-ear EEG provides a powerful, unobtrusive alternative.
In this blog, we introduce the three generations of our fatigue metric and demonstrate their validation specifically using in-ear EEG. (see Figure 1)
Note: For the foundational details on the InnoBrain fatigue metric using scalp EEG and our complete testing protocol, please check out our previous article: Decoding Fatigue Spectrum™: Moving Beyond Subjective Measures with InnoBrain DRIFT™ models.
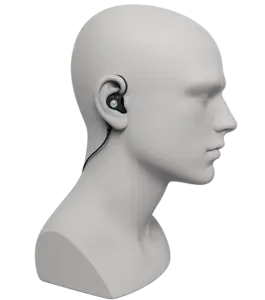
Figure 1. In-ear EEG and its installation over the ears.
The Evolution of the InnoBrain In-Ear Fatigue Metric
We currently classify our in-ear fatigue measurement capabilities into three distinct generations:
- InnoBrain DRIFT-B™ (The Basic Model): This foundational approach uses a core mathematical formula to calculate fatigue via the in-ear EEG. (For validation of this basic model, check out our earlier post: Measuring the “Invisible” Wall: Beyond Subjective Limitations By Validating InnoBrain’s Fatigue Metric).
- InnoBrain DRIFT-R™ (The Hand-Engineered Expert Model): A significant leap forward. This model introduces expert-designed heuristic rules to refine, filter, and stabilize the initial InnoBrain DRIFT-B™ measurements.
- InnoBrain DRIFT-O™ (The AI Model): Our premier, most sophisticated iteration. It builds upon the framework of InnoBrain DRIFT-R but leverages artificial intelligence to adapt to the user, achieving a far superior level of accuracy.
Proving the Models Work
To validate our in-ear algorithms, we utilized the exact same Psychomotor Vigilance Task (PVT) setup used in our scalp EEG studies (in fact, the in-ear data were recorded simultaneously with the scalp data, allowing for a perfect 1:1 comparison). As supported by both subjective KSS scores and behavioral lapse data, we treat the 1st PVT session as the “Alert” ground truth and the 3rd PVT session as the “Fatigued” ground truth. While we recognize this is not a flawless assumption, since individual baselines vary, meaning some subjects may begin the test already tired or resist fatigue altogether, it remains the most reliable practical standard (Cellini et al., 2023).
To quantify exactly how much IB DRIFT models outperforms its predecessors using only in-ear data, we evaluated all three models across three strict evaluation metrics. To evaluate the model’s ability to generalize across new participants, we implemented a Leave-One-Subject-Out Cross-Validation (LOSOCV) approach. In this iterative process, the model is systematically trained on data from all participants except one, who is reserved exclusively for testing. This rigorous procedure ensures that the evaluation accurately reflects how well the model performs on unseen individuals, effectively demonstrating its robustness and subject independence (see Figure 2):
- ROC AUC: This evaluates the model’s fundamental ability to distinguish between “Alert” and “Fatigued” states. It provides a threshold-independent measure of how cleanly the algorithm separates the two conditions. The basic InnoBrain DRIFT-B achieves a score of 0.58, and the InnoBrain expert DRIFT-R scores 0.62. In stark contrast, InnoBrain DRIFT-O demonstrates superior discriminatory power with an exceptional score of 0.93.
- F1 Score: Representing detection reliability, this metric balances precision and recall. It is especially critical when the costs of both false alarms (false positives) and missed detections (false negatives) carry significant weight. Evaluating the balance between precision and recall, InnoBrain DRIFT-B scores 0.56 while InnoBrain DRIFT-R achieves 0.72. InnoBrain DRIFT-O vastly outperforms them both with a score of 0.95, proving its high reliability even with complex in-ear data.
- Balanced Accuracy: Ensures fair performance evaluation across the board, preventing skewed results when one class has significantly more data than the other. InnoBrain DRIFT-B yields 0.67, and InnoBrain DRIFT-R reaches 0.61. InnoBrain DRIFT-O dominates this category as well, securing a score of 0.94.
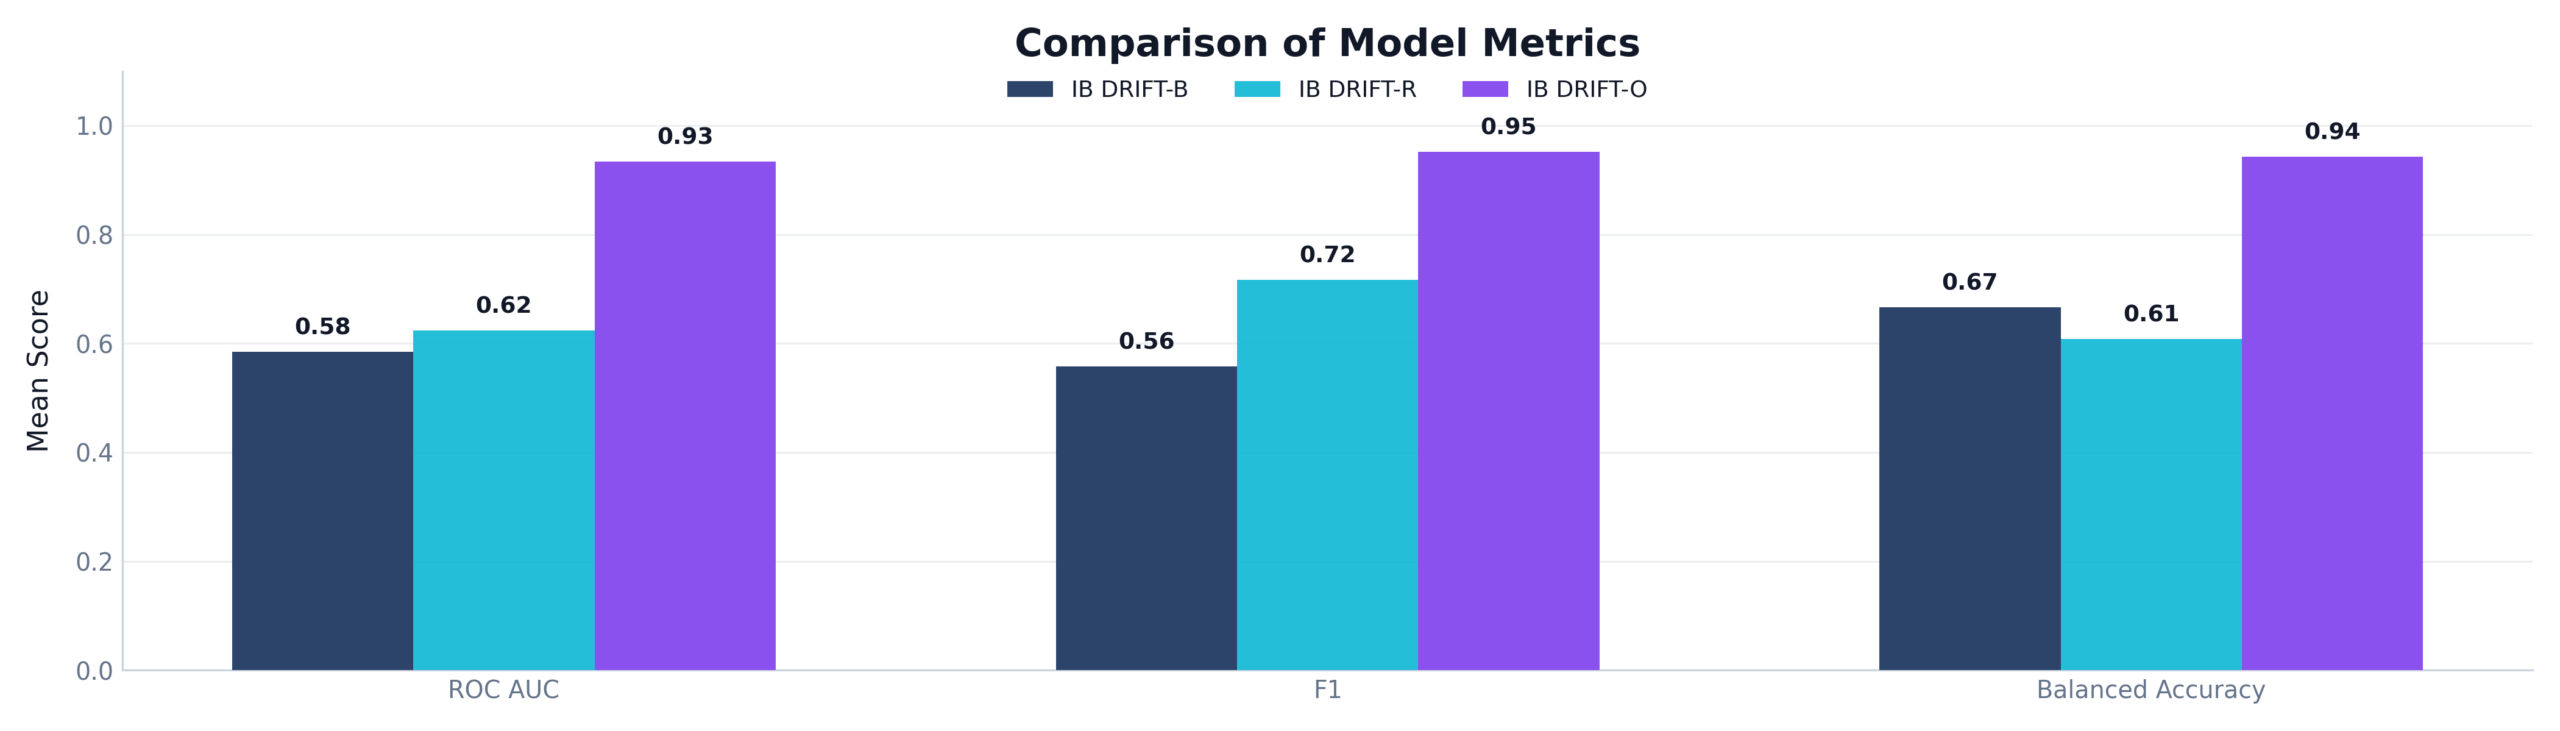
Figure 2. Comparison of ROC AUC, F1 Score, and Balanced Accuracy across the three proposed models.
The Models in Action
To truly see the difference in how these models behave, we plotted the average predicted fatigue of both InnoBrain DRIFT-R and InnoBrain DRIFT-O continuously over a 30-minute period (three back-to-back 10-minute PVT sessions). We also overlaid the subjective KSS scores for reference (see Figure 3).
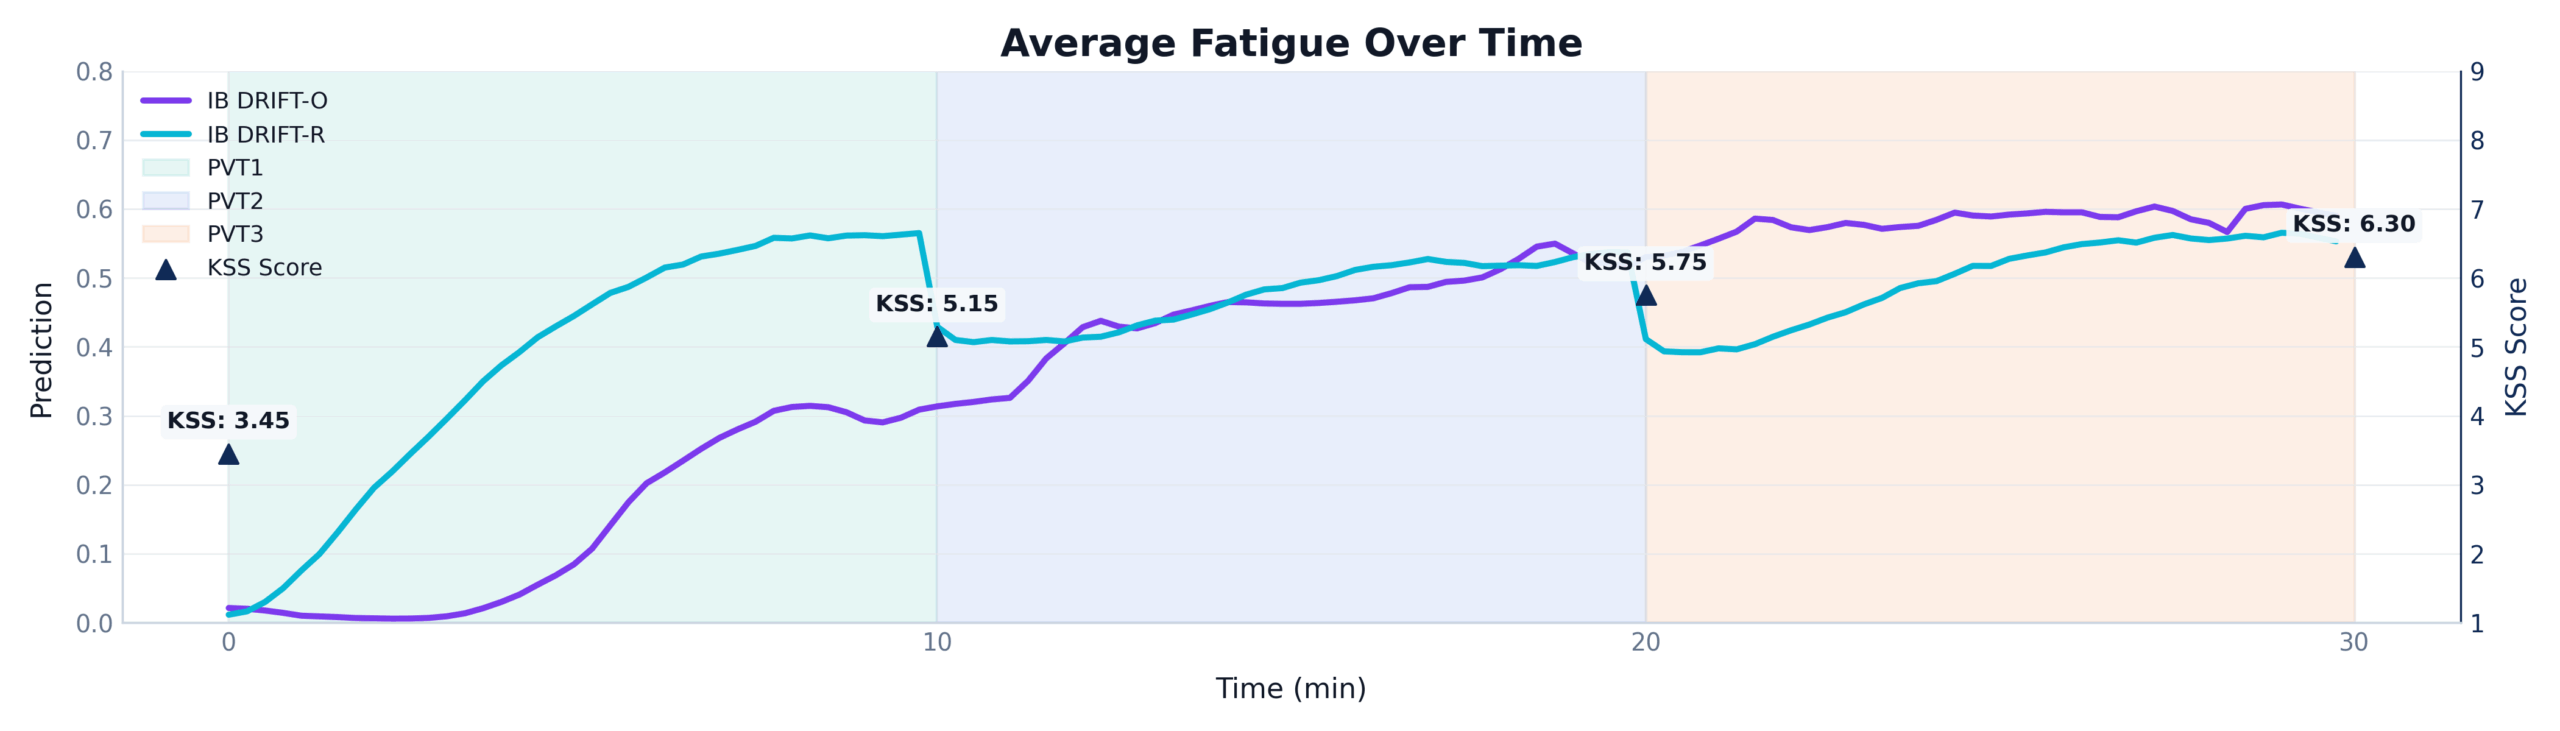
Figure 3. A time-series comparison of InnoBrain DRIFT-R (blue) and InnoBrain DRIFT-O (purple) averaged across three 10-minute PVT sessions.
The KSS scores (dark triangles) show a clear, steady accumulation of fatigue, rising from a baseline of 3.45 up to 6.30 by the end of the experiment.
It can be observed that the blue line representing InnoBrain DRIFT-R correctly captures the overall upward trend, but remains highly sensitive. InnoBrain DRIFT-R gets “tricked” by the subtle shift in arousal when a new task session begins, falsely dropping the fatigue score before climbing back up.
Now, look at the purple line representing our AI model (InnoBrain DRIFT-O). It remains incredibly smooth and stable. The AI is smart enough to ignore the superficial novelty of a new session starting. Instead, it accurately tracks the underlying, cumulative neurophysiological fatigue, perfectly mirroring the steady, relentless climb of the subject’s true tiredness.
AI as the Key to Wearable EEG
The transition from scalp EEG to in-ear EEG introduces significant challenges in data quality and signal availabilityو primarily due to lower signal amplitudes, reduced spatial resolution, and increased susceptibility to muscle and motion artifacts (Mikkelsen et al., 2015). Although recent advancements in skin-conformal dry polymer electrodes have shown promise in overcoming high impedance for continuous wearable monitoring (Stauffer et al., 2018), hardware improvements alone cannot entirely solve the problem. As our validation shows, relying on foundational math (InnoBrain DRIFT-B) or even hand-engineered expert rules (InnoBrain DRIFT-R) is not enough to overcome the noise of continuous, real-world monitoring.
InnoBrain DRIFT-O proves that AI is the missing link. By intelligently adapting to the user and tracking cumulative physiological shifts rather than superficial task changes, InnoBrain DRIFT-O transforms a simple in-ear wearable into a highly accurate, real-time fatigue monitor. As we continue to develop the InnoBrain metrics, it is clear that the future of cognitive load and fatigue monitoring lies in the powerful combination of low-profile hardware and highly adaptable AI.
References
- Cellini, N., Bruno, G., Orsini, F., Vidotto, G., Gastaldi, M., Rossi, R., & Tagliabue, M. (2023). The effect of partial sleep deprivation and time-on-task on young drivers’ subjective and objective sleepiness. International journal of environmental research and public health, 20(5), 4003.
- Mikkelsen, K. B., Kappel, S. L., Mandic, D. P., & Kidmose, P. (2015). EEG recorded from the ear: characterizing the ear-EEG method. Frontiers in neuroscience, 9, 438.
- Stauffer, F., Thielen, M., Sauter, C., Chardonnens, S., Bachmann, S., Tybrandt, K., … & Vörös, J. (2018). Skin conformal polymer electrodes for clinical ECG and EEG recordings. Advanced healthcare materials, 7(7), 1700994.